
Every spacecraft simulation ships with a validation claim, and most of them are unfalsifiable. “Validated against real mission data” tells you nothing on its own. Against which mission, on which metric, over what baseline, and compared to what reference?
The question matters because the honest answer is usually uncomfortable. A propagator can be correct to a hundredth of a percent on one metric and twenty kilometres wrong on another, in the same run, and both numbers can be true. Which one appears in the README is an editorial decision, not a technical one.
What follows is the validation record for cislunar-sim against LightSail 2, used as a worked example. The library is beside the point. The question is one you should be asking of any propagator, including the ones with decades of heritage.
The Headline Number Is the Least Interesting One
Replaying a one-day archival epoch from LightSail 2 (NORAD 44420, roughly 585 km altitude) against SGP4-propagated reference states produces a semimajor-axis error of 0.0113%, which on its own reads as a finished argument.
In the same run, mean position error is 19.58 km, rms 25.97 km, maximum 54.84 km.
Both are correct. They describe different things. Semimajor axis is an orbital energy measure and barely moves; position is where the spacecraft actually is. Quoting the first without the second is not a lie, but it invites a reader to conclude something the data does not support.
For the avoidance of doubt about who this criticism is aimed at: cislunar-sim’s README leads with “under 0.05% SMA error”. The single-scalar headline is mine. It is not dishonest. The number is real and the full record sits one click away. But it is the flattering half of a pair, and choosing it was an editorial decision I made without much thinking about it.
The Decomposition Is the Finding
Splitting that position error into radial and along-track components turns the run from a score into evidence:
- Radial error: 0.449 km, 0.006% of orbital radius
- Along-track error: 19.559 km mean
- Cross-track error: negligible; the radial and along-track terms alone recover the 19.58 km total
Cross-track is worth reporting even at zero, because it is the axis that would reveal an inclination or RAAN error, a different failure mode entirely from the phase drift diagnosed below, and finding nothing on that axis is itself informative.
Along-track error exceeds radial by more than a factor of forty. Forty to one is a signature. A propagator whose radial position is tight but whose along-track position drifts is getting the shape of the orbit right and its phase wrong, which puts the spacecraft on the correct ellipse but in the wrong place along it.
For a 585 km orbit that points squarely at drag. Atmospheric density at that altitude varies with solar activity in ways no model captures to better than tens of percent, and the resulting acceleration error integrates into phase. The decomposition turns “20 km off” from a failure into a measurement of a known-unmodelled term.
A single scalar error could never have told you that. So the first thing to ask of any validation claim is not how large the error is, but whether it has been decomposed into components that can be attributed to physics.
You Are Comparing Against a Model, Not Against Truth
A subtler problem sits underneath the run above. SGP4 is not ground truth. It is itself an analytic propagator, fitted to observations, with its own error budget, typically kilometres in along-track position, degrading with epoch age. Comparing a numerical integrator against SGP4 measures agreement between two models.
It still earns its place. It catches sign errors, unit mistakes, and missing force terms, and it runs in CI. But it establishes consistency rather than accuracy, and a validation record that stops here has tested less than it appears to.
Hold onto that objection, because it returns. The next section leans on B*, and B* is a parameter of SGP4, the same model just disqualified as a reference. The defence is that B* is fitted to tracking observations rather than propagated from a model, and that a ratio between two fits cancels much of the shared error, which holds up as far as it goes but not on its own.
The Test I Thought Was Strongest
One principle needs stating before the example, because it survives what follows. The strongest validation available is rarely the most direct comparison. It is usually the one whose reference the model could not have been tuned to reproduce, an observable produced by some process that knows nothing about your simulation.
LightSail 2 appears to offer one. Atmospheric drag and solar radiation pressure act in opposite senses, so while a sail is pushing outward, the TLE fitting process observes less net deceleration and reports a lower ballistic coefficient. B* is fitted from tracking data by someone else’s pipeline. Split the CelesTrak archive into an early window and a late one and the numbers are striking:
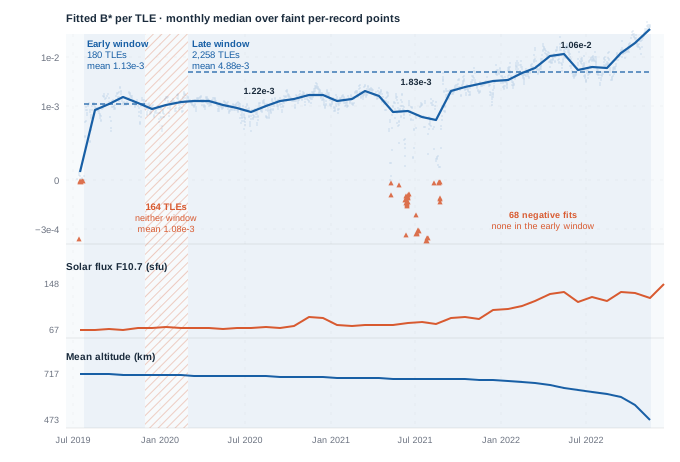
- Early window (Jul–Dec 2019, 180 TLEs): mean B* 1.127 × 10⁻³
- Late window (Mar 2020–Nov 2022, 2,258 TLEs): mean B* 4.883 × 10⁻³
Those counts sum to 2,438 against an archive of 2,680. The other 242 are accounted for. Sixty-eight records were discarded for reporting a negative ballistic coefficient, 10 predate the window, and 164 we will come back to. Two of those three numbers matter. Hold that thought.
Observed ratio 0.231, against 0.228 predicted — the prediction computed from the drag-versus-SRP formulation in Spencer et al. (2021), not a figure that paper reports. Relative error around 1%, over a three-year baseline, using an observable nobody involved was trying to make agree.
I described that as the record’s strongest quantitative signal. It was not, and working out why has been more useful than the result would have been.
Six Reasons It Establishes Nothing
The premise is false. The two windows were labelled sailing and passive, the latter meaning the period after the sail was furled. LightSail 2 never furled its sail. It deployed on 23 July 2019 and stayed deployed until reentry on 17 November 2022; no furling or retraction occurred at any point in the mission. What varied was attitude. The spacecraft slewed between face-on and edge-on, a cadence regularly interrupted by momentum-wheel desaturation. The physical contrast the comparison rests on does not exist.
The windows are confounded, and the confound is the whole signal. The early window sits at solar minimum near initial altitude; the late one spans the Cycle 25 ramp while the orbit decays toward reentry. Fitted B* is not a clean ballistic coefficient — it absorbs density-model error, and SGP4’s atmosphere is a fixed profile not driven by observed solar flux, so B* rises as real density outruns it. Altitude decay pushes the same way.
Break the late window into years and there is nothing left to attribute to sailing:
- Mar 2020 – Jan 2021: mean B* 1.22 × 10⁻³
- Jan 2021 – Jan 2022: 1.83 × 10⁻³
- Jan 2022 – Nov 2022: 1.06 × 10⁻²
The early window’s mean is 1.13 × 10⁻³. For the first ten months of the supposedly passive period, B* is indistinguishable from the sailing period. The 4.3× difference between the two windows comes almost entirely from 2022, when the spacecraft was falling out of the sky. The comparison is not measuring a sail against no sail. It is measuring an orbit at 720 km against the same orbit on the way to reentry.
The prediction and the observation are not in the same regime. The predicted ratio is evaluated at one fixed condition — 720 km, solar flux F10.7 = 100 — which is a reasonable place to stand: it is roughly where the spacecraft spent the early window. The observation does not stay there. The late window runs to reentry, where density is orders of magnitude higher and the physics driving B* is not the physics the prediction assumed. A single-point prediction is not the flaw; comparing it against a window that leaves the point behind is.
The prediction never touches the model it supposedly validates. This is the one that should have stopped me. The predicted ratio is computed inline from literal constants (density, velocity, drag coefficient, sail area, mass, reflectivity) and calls none of the library’s physics. Whatever agreement it shows is between a hand-written formula and an observation. The force model is not in the loop. It is also why a later bug fix that increased modelled SRP force by 72% moved neither number, since neither is derived from the code that changed.
The windows also drop the transition. The arithmetic above is the fifth problem. The two windows are not adjacent: December 2019 to March 2020 falls in neither, discarding 164 TLEs, and nothing in the code or the record says why. Those records average 1.08 × 10⁻³ — the early window’s level, not the late window’s. Fold them into the late window where the dates put them and the ratio moves from 0.231 to 0.244, agreement from about a percent to nearly seven. The exclusion flatters the result by a factor of six. Every other problem here is a confound. This one was a choice, and nobody wrote it down.
One of the exclusions moves the answer. Those 68 discarded records are all negative ballistic coefficients, and a negative B* is what a fitter reports when an object gains orbital energy rather than losing it. None of them fall in the early window, so the filter acts on one side of the comparison only. Put them back and the late-window mean drops, the ratio rises from 0.231 to 0.237, and agreement with the prediction falls from about 1% to about 4%, close to four times worse. Discarding negative fits is a defensible default, and plenty of them are noise. Doing it on one side of a comparison, describing it as a plausibility filter when it only ever removes negatives, and never measuring what it does to the headline number is not.
Under those conditions, agreement of about a percent is better read as coincidence than as confirmation. The contrast being tested never happened. Three effects push the measured difference the same way. The prediction is evaluated in the wrong regime and never touches the model. The window that would have shown a change was removed, and the agreement itself rests on a one-sided exclusion nobody had measured.
What would fix it, in the order I would do it: make the windows contiguous, so nothing is discarded without a reason anyone can read. Then restrict both to comparable solar-flux and altitude bands so the residual difference is attributable to sail behaviour, or normalise fitted B* against a contemporaneous non-sailing object in a similar orbit, cancelling the shared density-model error. Then compute the prediction from the library’s own force model at each window’s actual conditions, so the comparison tests the code rather than a formula standing beside it.
The principle I opened with still holds. B* really is an observable the simulation had no hand in producing, and that really is the right kind of reference. But finding the right kind of test is one thing and running it correctly is another, and a number agreeing to within a percent is very good at hiding the gap.
The Test That Did Not Work, and Knew It
The eclipse comparison fails too, but it fails honestly, which makes it the more useful of the two.
SatNOGS beacon frames report an eclipse flag at roughly 45-second cadence. Compare the transitions against the shadow model (Earth umbra and penumbra, plus lunar occultation) and entry residuals come out at mean +3.7 s, standard deviation 19.5 s, from 29 usable windows. The comparison identifies 48 exit windows as well, but computes no residuals from them.
That looks like agreement. Quantify it and the picture is clearer: with n = 29 and σ = 19.5 s, the standard error on the mean is 19.5/√29 = 3.6 s. So the result is +3.7 ± 3.6 s, about one standard error from zero. That rules out a fifteen-second bias, though it cannot distinguish zero from five.
It is also a heavily filtered sample. Of 13,917 frames across three years, 503 transition windows were discarded as too sparsely sampled to time. Entries survive that filter far less often than exits, 29 against 48, and nothing in the record says why. It is probably an artefact of when ground stations happened to be listening rather than anything physical, but that is a guess, and an unexplained asymmetry in a filtered dataset is the sort of thing a reader should want explained rather than assumed.
This is the better failure because the record says so. The library’s own documentation calls it encouraging agreement, but not yet a strong timing validation. The B* result carried no such sentence, which is why it went unexamined for longer.
Reproducible and Merely Reported Are Different Claims
The last distinction is the one most often collapsed. Three of these checks run from a clean clone with bundled data, on every push:
- SMA error, from bundled LightSail 2 TLEs across 5 historical epochs
- Radial error, same source
- Sail force against McInnes (1999) Table 2.1, IKAROS parameters, within 1%
Three do not. The B* swing needs the full CelesTrak GP-history archive; the eclipse and attitude comparisons need SatNOGS beacon frames. Neither is redistributable here, so both are reported results that a reader must fetch data to reproduce.
I used to state the tension the other way round: the checks that run automatically are the weaker ones, and the real evidence sits in the comparisons you have to fetch data by hand to run. It cut the other way. The checks that run unattended on every push are the ones that held. The result requiring a manual fetch is the one that collapsed, and it went unexamined longer for that reason. Nobody re-runs a number nobody can re-execute. A CI badge proves less than it implies. It also gets looked at more often, which matters more than I gave it credit for.
What to Ask of Any Propagator
None of this is specific to one library. Applied to GMAT, Orekit, or anything else with a validation section, the questions are the same:
- Which metric? An impressive number on one axis may coexist with a poor one on another.
- Decomposed how? Radial versus along-track separates orbit shape from orbit phase, and the ratio attributes the error.
- Against what reference? Comparison against another model establishes consistency; an independently fitted observable establishes more.
- Over what baseline? Longer only helps if what varies across the baseline is the thing being measured. Three years across a rising solar cycle gave me more data and a worse test.
- Over what regime? A model is exercised over some range of conditions and not others. If the comparison spans regimes the model was never tested in, agreement there is not evidence — and a record that does not state its envelope cannot be checked on this at all.
- Reproducible, or reported? And if reported, what would it take to check?
- Does the prediction exercise the model? A predicted value computed beside the code rather than by it tests a formula, not a simulation.
- What else differs between the compared groups? If several candidate causes push the same way, agreement is not attribution.
- What failed? A record with no negative results has not finished looking, and the results with no caveat attached are the ones to check first.
Mature tools carry heritage a young library cannot. If you are flying hardware that heritage is usually the deciding factor, and it should be. But heritage is an argument from authority. The one advantage of a validation harness built from ordinary test code is that you can go and check the number yourself.
I would rather have found the B* problem before publishing than after. Failing that, a record that documents its own worst result beats one that quietly drops it, and this one now does.
The full record, including methodology and the data-acquisition steps for the external comparisons, is in VALIDATION_RECORD.md. The architecture behind it is covered in the cislunar-sim field note.
cislunar-sim is available on GitHub and PyPI under the MIT license.